
Selected Infographics
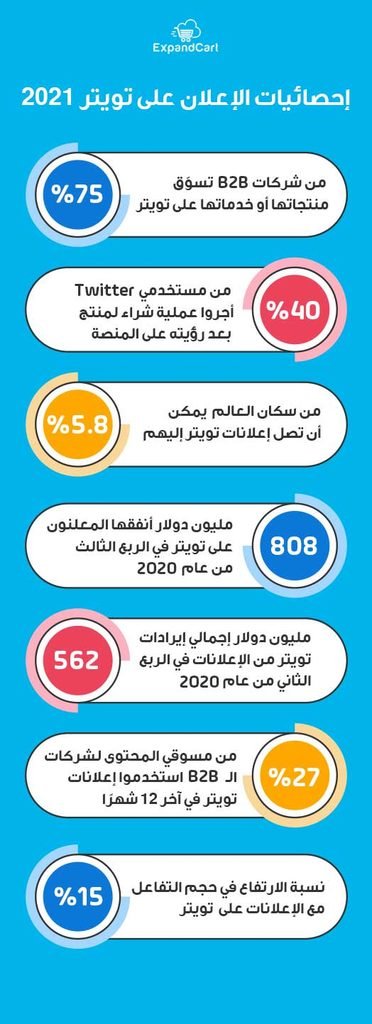
أرقام وإحصائيات الإعلان على تويتر في 1202

أرقام وإحصائيات هامة حول البيانات الضخمة
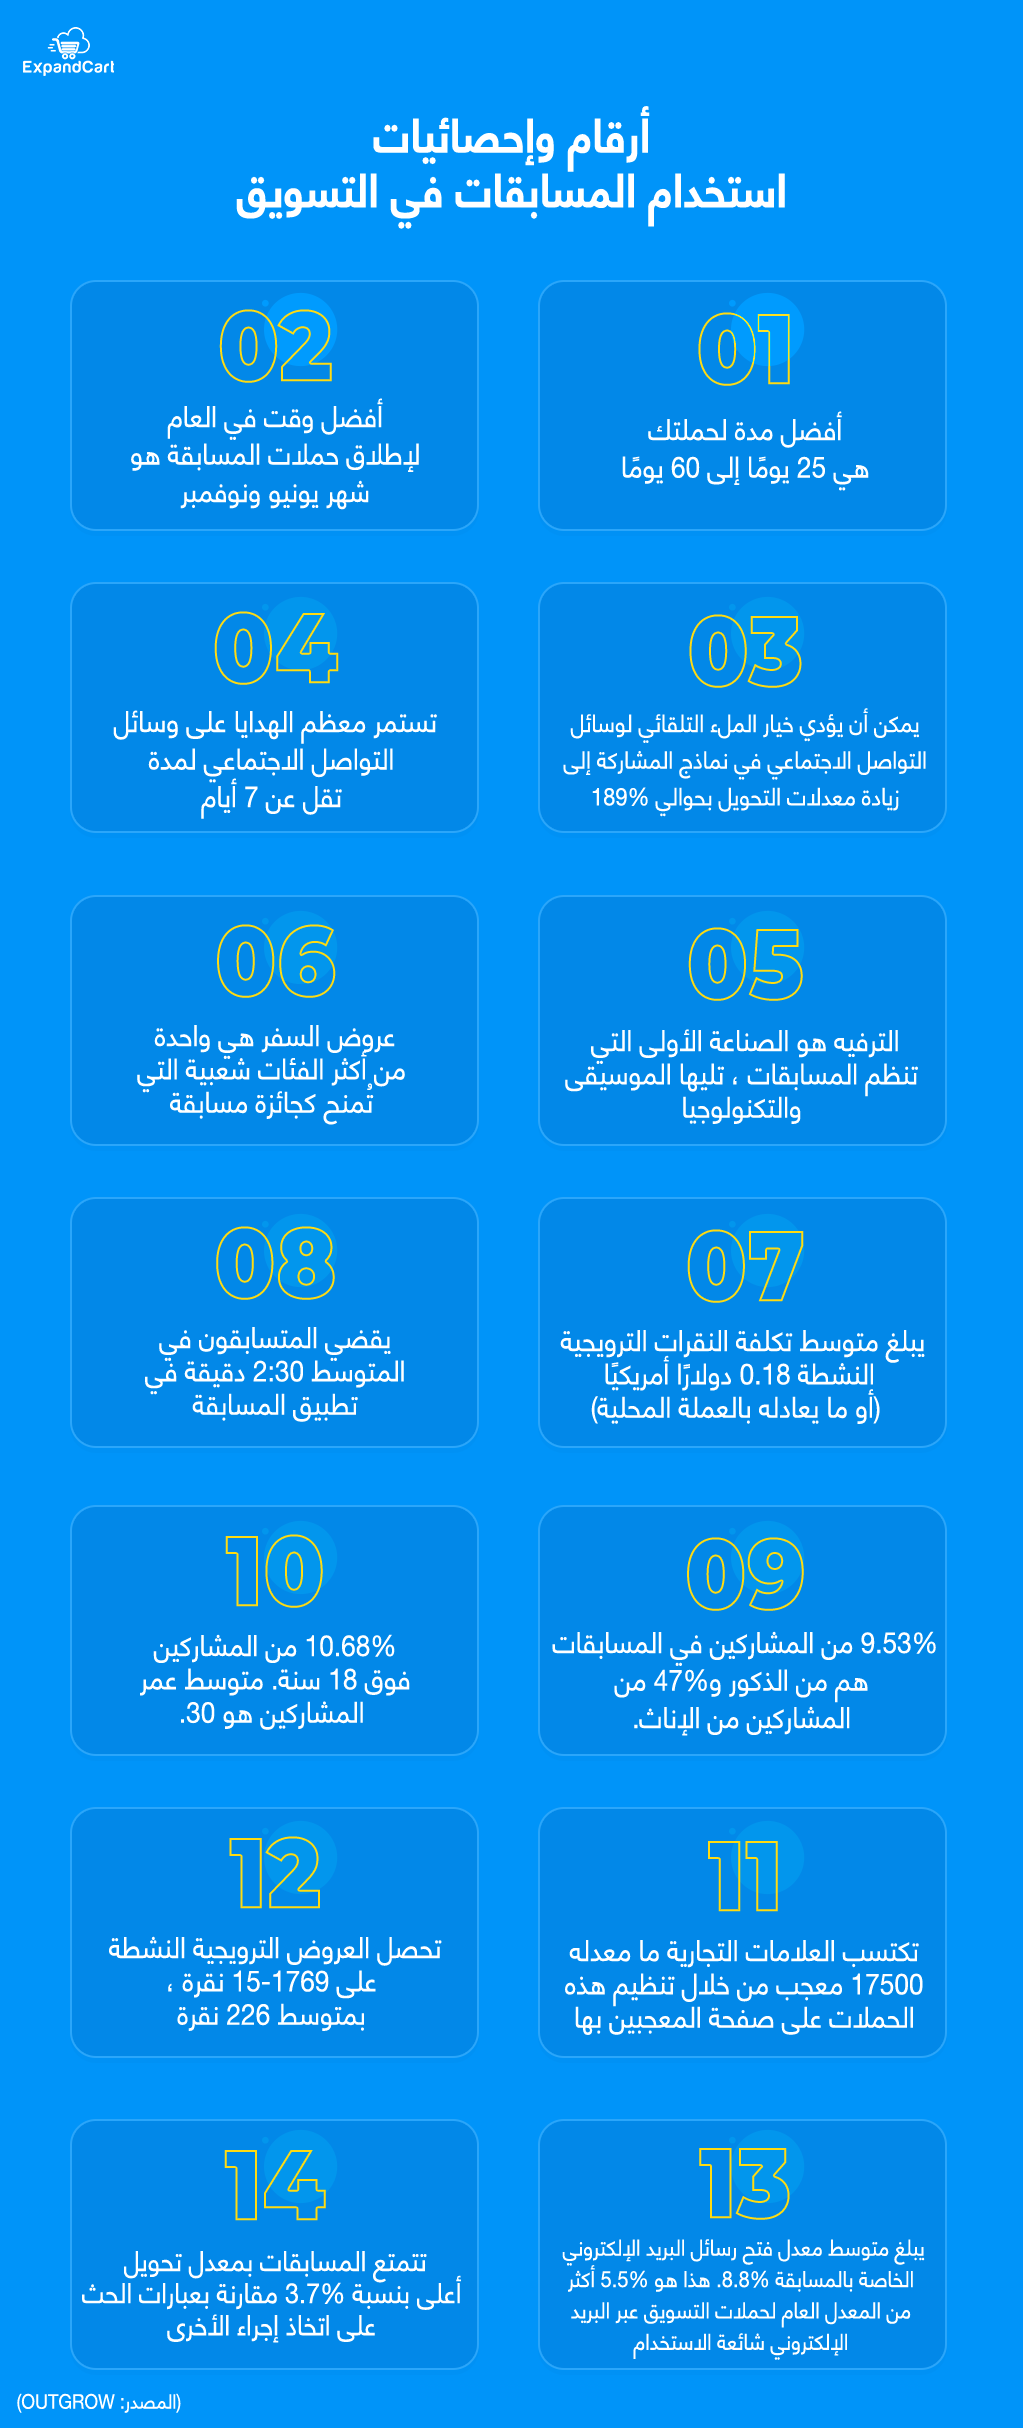
أرقام وإحصائيات استخدام المسابقات في التسويق
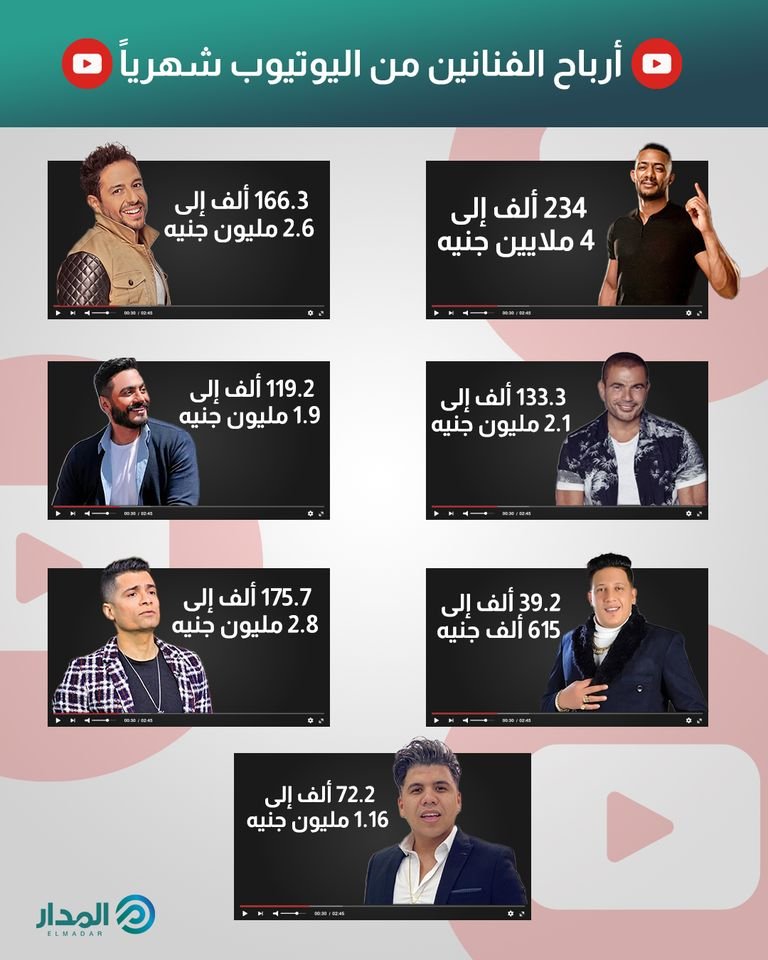
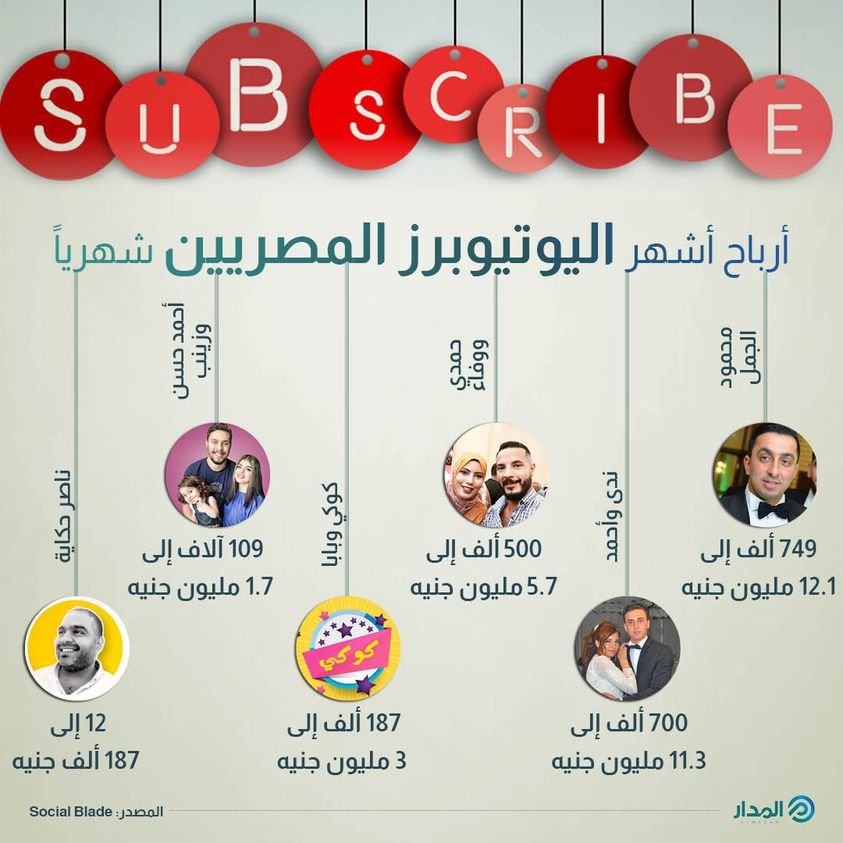
بعد إلزامهم بفتح ملفات ضريبية.. تعرف على أرباح الفنانين من اليوتيوب شهرياً
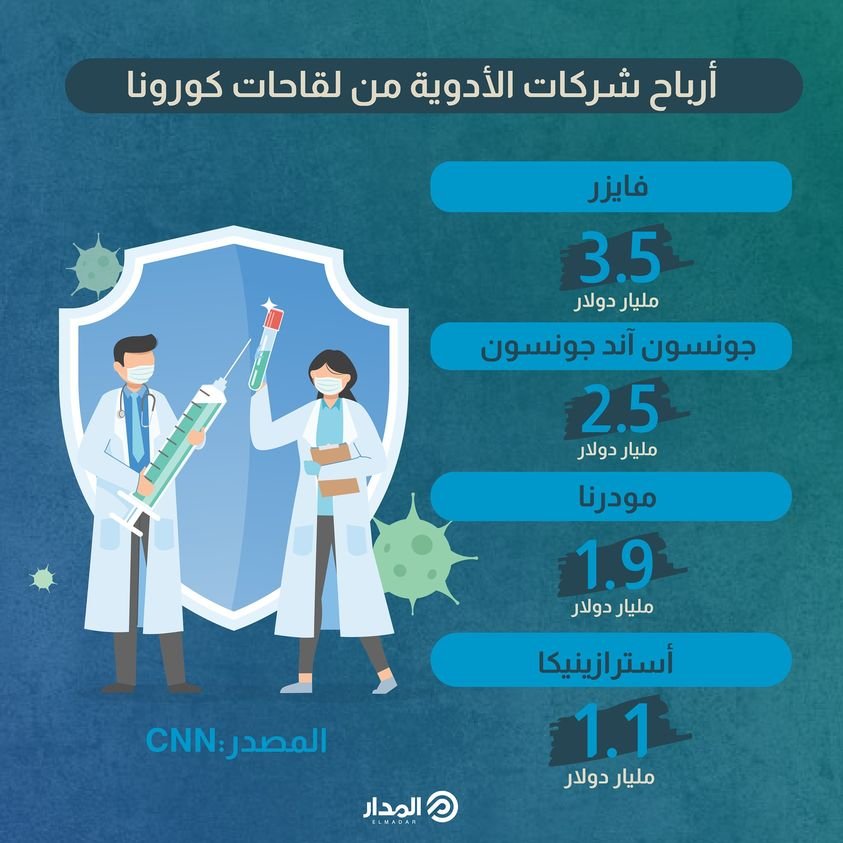
رب ضارة نافعة.. كم بلغت أرباح شركات الأدوية من بيع لقاحات #كورونا 🦠؟
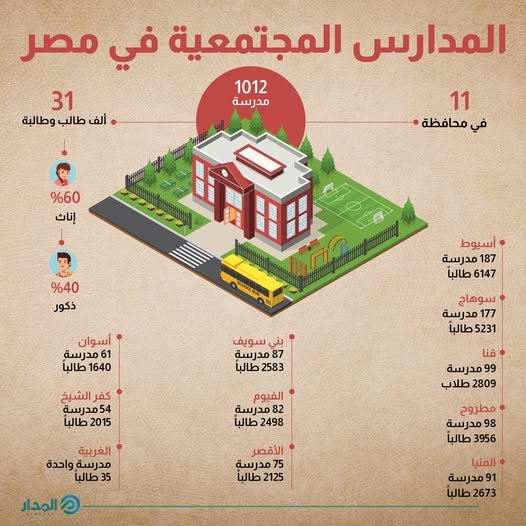
لحل كارثة التسرب من التعليم.. 2101 مدرسة مجتمعية تعرف على أماكنها
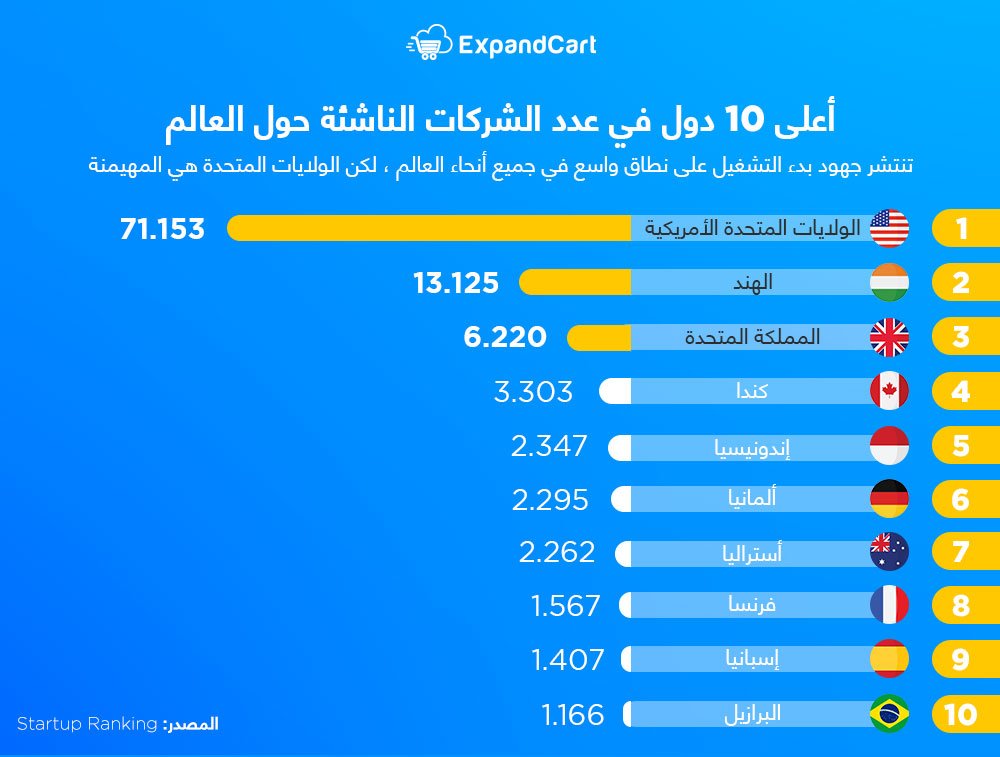
أعلى 01 دول في عدد الشركات الناشئة
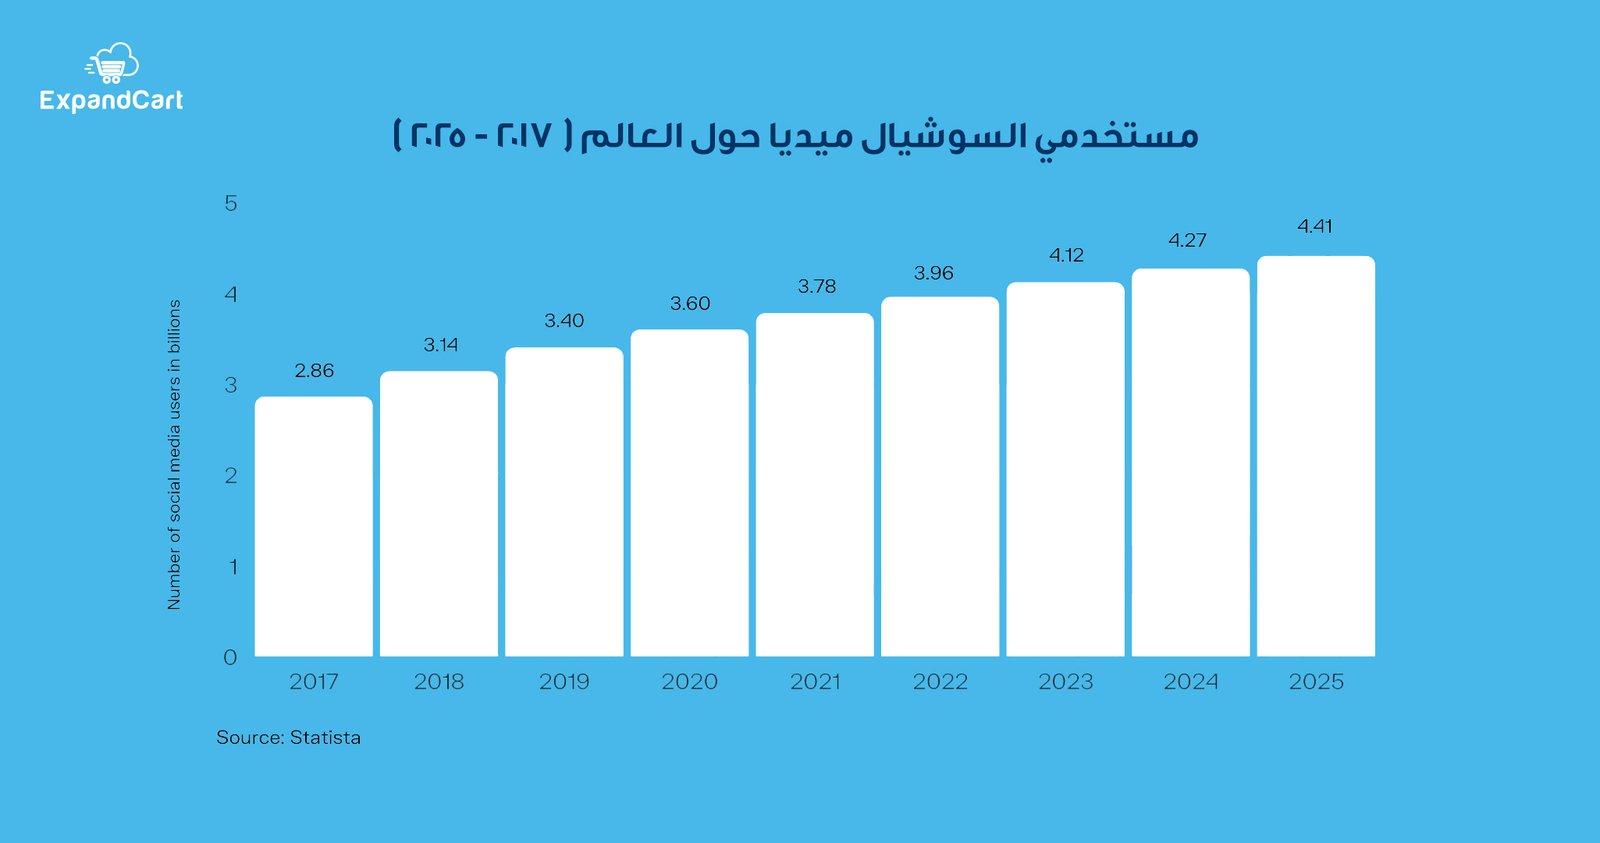
أرقام مستخدمي منصات التواصل الاجتماعي عالميًا